BAY AREA FLOOD EXPLORER
Interactive Digital Map
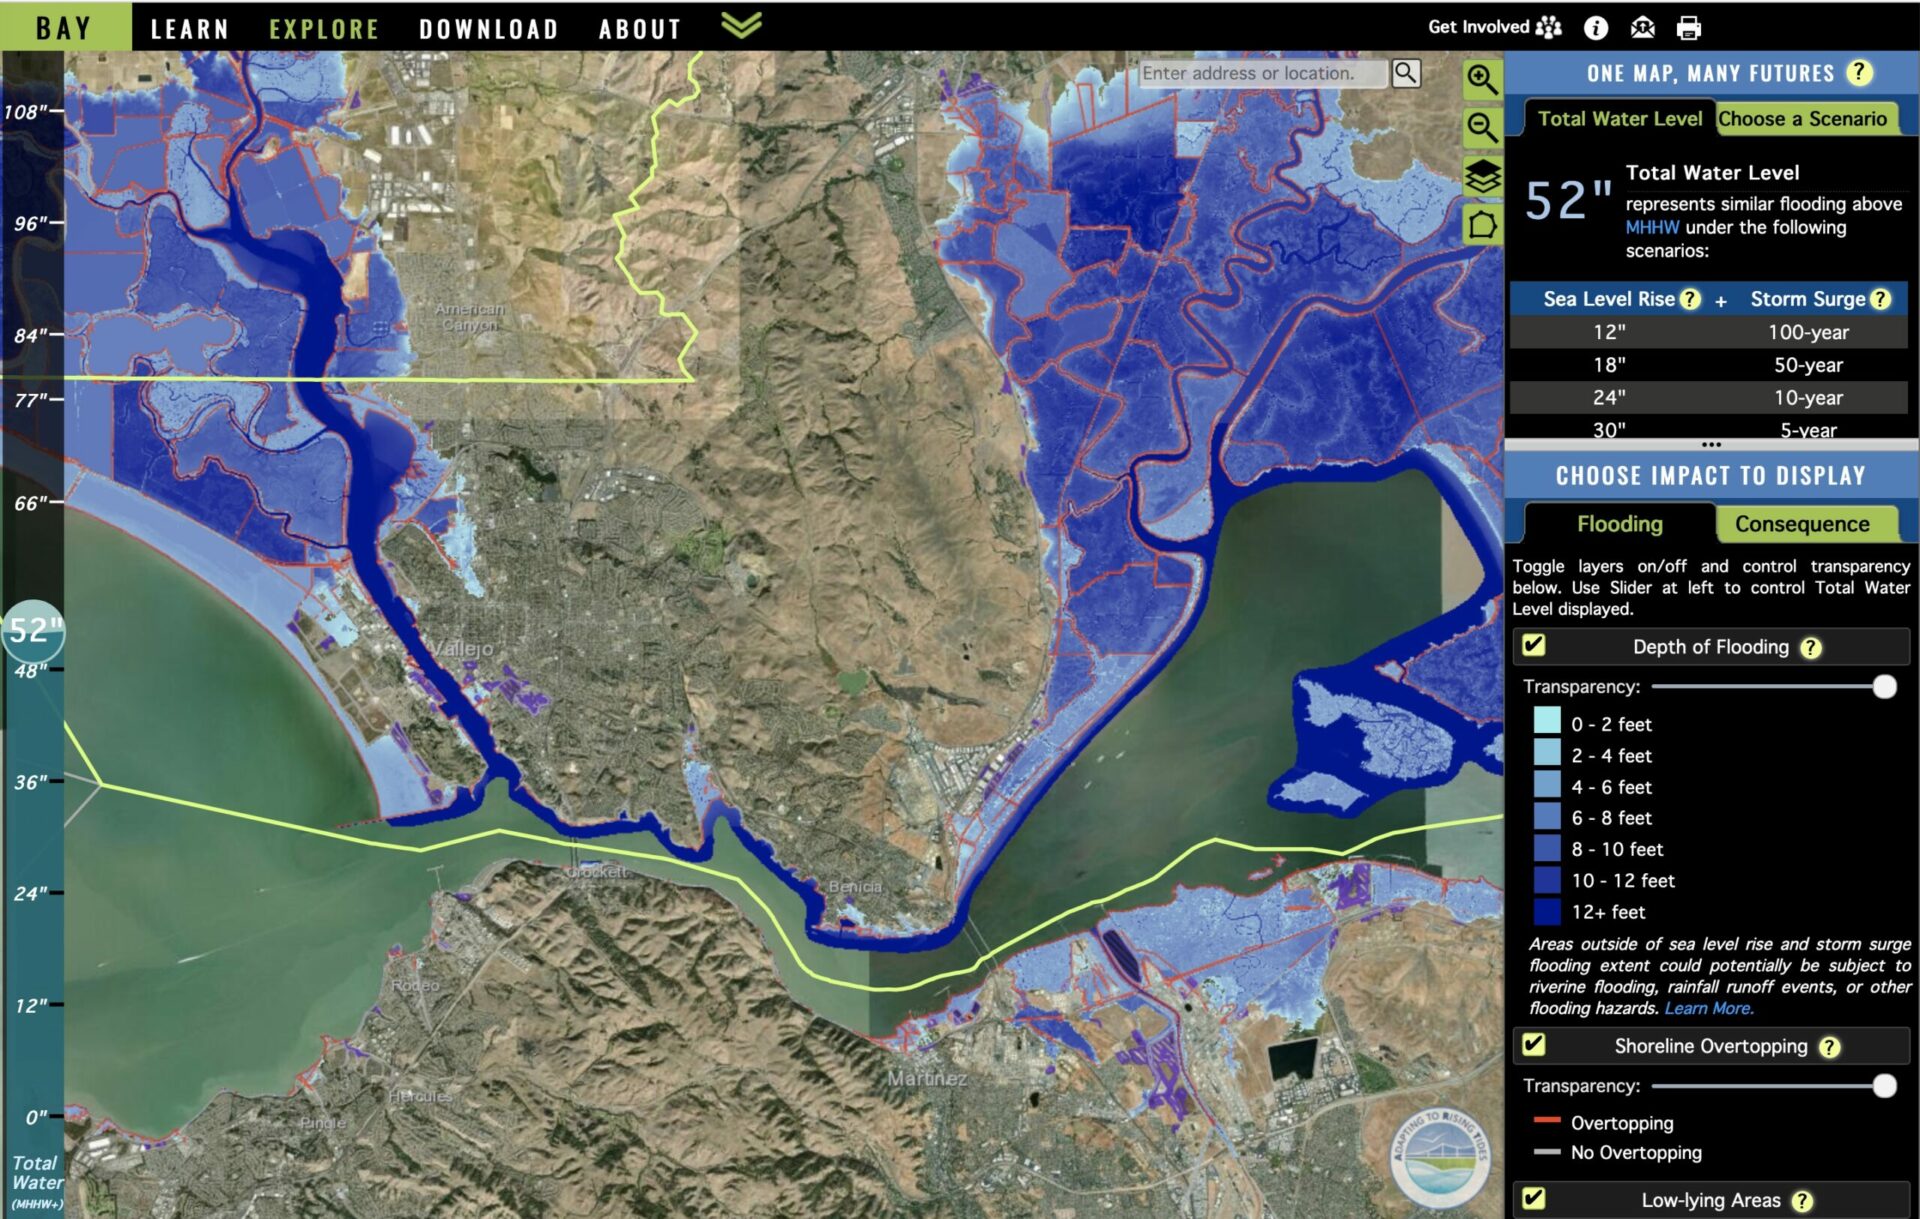
Ever wondered what regional government is doing to help prepare your city for sea level rise? The San Francisco Bay Conservation and Development Commission’s Adapting to Rising Tides program offers a tool that helps users visualize how future flooding will impact highways, jobs, homes, and habitats along the Bay shoreline.
“This map is really rich in information that allows people to drill down into their special spots — their communities, their homes, their businesses — and understand potential flood impacts. Before we made this mapping available, there wasn’t really any way for the public to access this information.”
Todd Hallenbeck, SF Bay Conservation & Development Commission
ABOUT THE FLOOD EXPLORER
BCDC is best known for regulating fill and development along the shoreline, but this regional agency’s Adapting to Rising Tides (ART) program also works with Bay Area cities and counties to help them understand how sea level rise will impact where people live, work, and play, and what can be done about it. The Flood Explorer and associated flood maps are intended to be used as a planning guide to understand where the Bay shoreline is at risk from current and future flooding from sea level rise and storms. The maps:
- Show low points along the shoreline that can lead to inland flooding, enabling resources to be directed to areas that pose the greatest risk.
- Present flooding as a “Total Water Level” above mean higher high water (MHHW), which represents various combinations of storm-surge and sea level rise. In using this approach, the Flood Explorer communicates that some areas will be temporarily flooded before they are permanently inundated and therefore, supports development of early-, mid-, and long-, term thresholds for action.
- Provide high quality spatial information to support planning given that these high-resolution maps were carefully reviewed by local stakeholders.
Learn the Basics: The story behind the map, which will help users better understand how to navigate the map, and what the data layers mean that they may be choosing.
Community Vulnerability Map: Another mapping tool, including a directory of CBOs, that can help planners connect with the communities they are trying to protect, and vice versa.
Lead Contacts
- Jaclyn Mandowske, Senior Climate Adaptation Planner
- Help Desk, ART, SF Bay Conservation & Development Commission

